Introduction
Patent claim charts are the foundational document of patent infringement analysis — the structured map that shows how each element of a patent claim reads on a specific product or process.
Building a single claim chart manually takes an experienced patent professional 8-20 hours. Scaling that across hundreds of licensing candidates takes months. AI does the same work in hours.
The Claim Chart Challenge at Scale
A patent claim chart maps each limitation of an independent claim to specific features of a target product — supported by technical evidence: product specifications, regulatory filings, patent cross-references, and technical documentation.
The challenge is scale. A licensing programme targeting 50 companies across a 100-patent portfolio requires thousands of claim chart mappings. Manual production at 8-20 hours per chart is not commercially viable.
100 target patents × 50 companies = 5,000 potential mappings
At 8 hours per chart = 40,000 hours of manual work
AI-generated claim charts: same coverage in a fraction of the time
How AI Builds Claim Charts
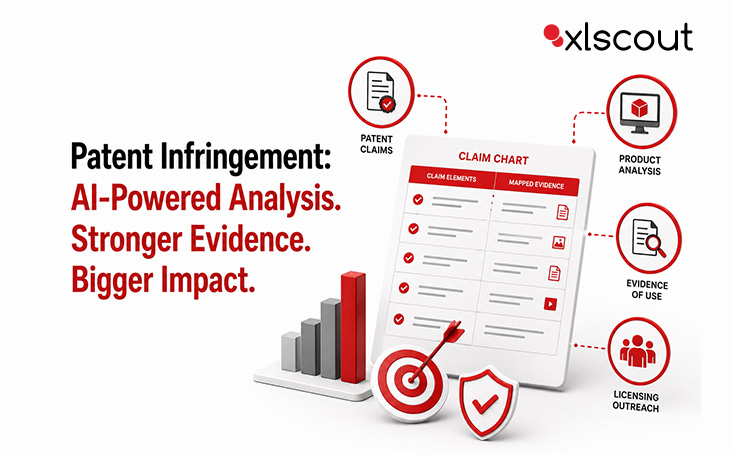
XLSCOUT’s ClaimChart LLM automates the claim chart generation process — extracting claim elements, identifying product features, and mapping each limitation to supporting evidence from publicly available technical documentation.
The AI claim chart generation process:
- Claim element extraction: automatic identification and parsing of each independent and dependent claim limitation
- Product feature matching: semantic search across technical documentation, product specs, and standards documents
- Evidence identification: specific passages, figures, and cross-references that support each claim element mapping
- Chart formatting: structured output ready for attorney review and licensing communication
AI-generated claim charts are not final legal documents — they are the first-pass mapping that compresses what was a 10-20 hour attorney task into a reviewed, verified output in hours.
How AI Maps Evidence of Use
Evidence of use (EoU) analysis goes beyond claim chart generation — it identifies the specific technical evidence that demonstrates a product practises each claim limitation.
XLSCOUT’s AI-powered evidence of use analysis searches across product technical documentation, patent family publications, standards body submissions, and engineering specifications — finding the evidence that turns a preliminary claim mapping into a documented infringement analysis.
Sources searched automatically:
- Technical data sheets and product specifications
- Standards body submissions (3GPP, ETSI, IEEE)
- Target company’s own patent filings
- Regulatory submissions and certification documents
How AI Scales Licensing Campaigns
The combination of AI claim chart generation and evidence of use analysis makes systematic licensing campaigns operationally feasible for the first time.
PatDigger LLM identifies the companies most likely to be practising your claims — ranked by overlap score. ClaimChart LLM generates the preliminary claim charts for the highest-priority targets. The attorney reviews and verifies the output — then proceeds to outreach with a documented infringement analysis already prepared.
- Portfolio screening: PatDigger identifies which patents have licensing potential and against which companies
- Priority ranking: companies ranked by claim overlap score — highest confidence targets first
- Chart generation: ClaimChart LLM produces preliminary claim charts for priority targets
- Attorney review: verify the AI output, supplement with judgment, proceed to outreach
XLSCOUT ClaimChart LLM + PatDigger LLM — AI-powered patent infringement analysis: claim chart generation, evidence of use mapping, and licensing campaign scaling.