

Introduction
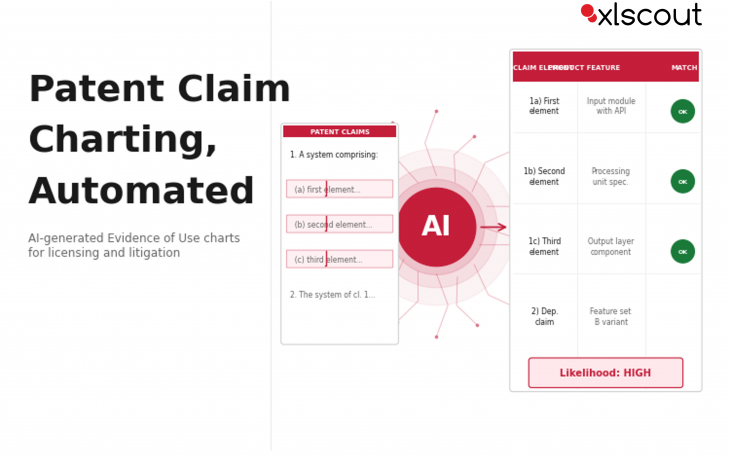
Patent claim charts are the foundation of patent licensing, enforcement, and litigation. They map each element of a patent claim to a specific feature of an accused product — providing the structured evidence that supports infringement assertions, licensing negotiations, and litigation strategy. Producing them manually is one of the most time-consuming tasks in IP practice.
XLSCOUT ClaimChart LLM automates the product research, feature matching, and claim mapping process — generating structured Evidence of Use charts in a fraction of the time required by traditional manual approaches.
What Is Patent Claim Charting?
A claim chart — also called an Evidence of Use (EoU) chart — is a table that maps each element of one or more patent claims to specific features, functionality, or specifications of an accused product. It is the primary document used to demonstrate patent infringement in licensing negotiations, IPR proceedings, and district court litigation.
Generating a complete claim chart requires: identifying which products may practice the asserted claims, researching each product’s technical features from publicly available documentation, mapping each claim limitation to a specific product feature, and citing the source documentation for each feature. The full process of automating EoU chart creation is where AI delivers its highest value in the licensing workflow.
Why Claim Charting Matters
Patent licensing and enforcement begin with a credible infringement position. A well-constructed claim chart — one that maps every claim element to a documented product feature, with source citations — is what makes an infringement assertion credible rather than speculative. Without it, licensing conversations stall and litigation risks become unmanageable.
The economics of claim charting determine which patents can be actively enforced. At 10 to 30 hours of attorney or analyst time per claim chart, patent infringement analysis becomes cost-prohibitive for all but the highest-value targets — limiting the scope of any licensing program.
The Limits of Traditional Claim Charting
It is expensive and slow
Generating a single claim chart typically costs $3,000 to $10,000 in attorney or paralegal time. For a portfolio licensing campaign targeting 50 products across 20 patent families, the pre-negotiation claim chart cost can exceed $500,000 — before any licensing revenue is generated.
Product research is manual and incomplete
Finding all the relevant product documentation — specifications, user manuals, technical white papers, patent filings by the accused party, product videos, and website content — requires extensive manual research for each product. Coverage is inevitably incomplete.
Claim mapping misses indirect infringement
Manual claim charting focuses on the most obvious products and the clearest claim element matches. Indirect infringement, joint infringement across supply chains, and infringement by less prominent products in an accused party’s lineup are systematically missed because manual processes cannot scale to comprehensive coverage.
Updates require full re-engagement
As products evolve, new models launch, and the accused party modifies features to design around assertions, claim charts become stale. Updating them requires repeating the full research and mapping process.
How AI Improves Patent Claim Charting
AI claim charting tools automate the product research phase, match claim elements to product features using semantic AI rather than keyword matching, generate structured claim-to-feature tables with source citations, and continuously surface new products that may practice the asserted claims.
XLSCOUT ClaimChart LLM and Evidence of Use Generation
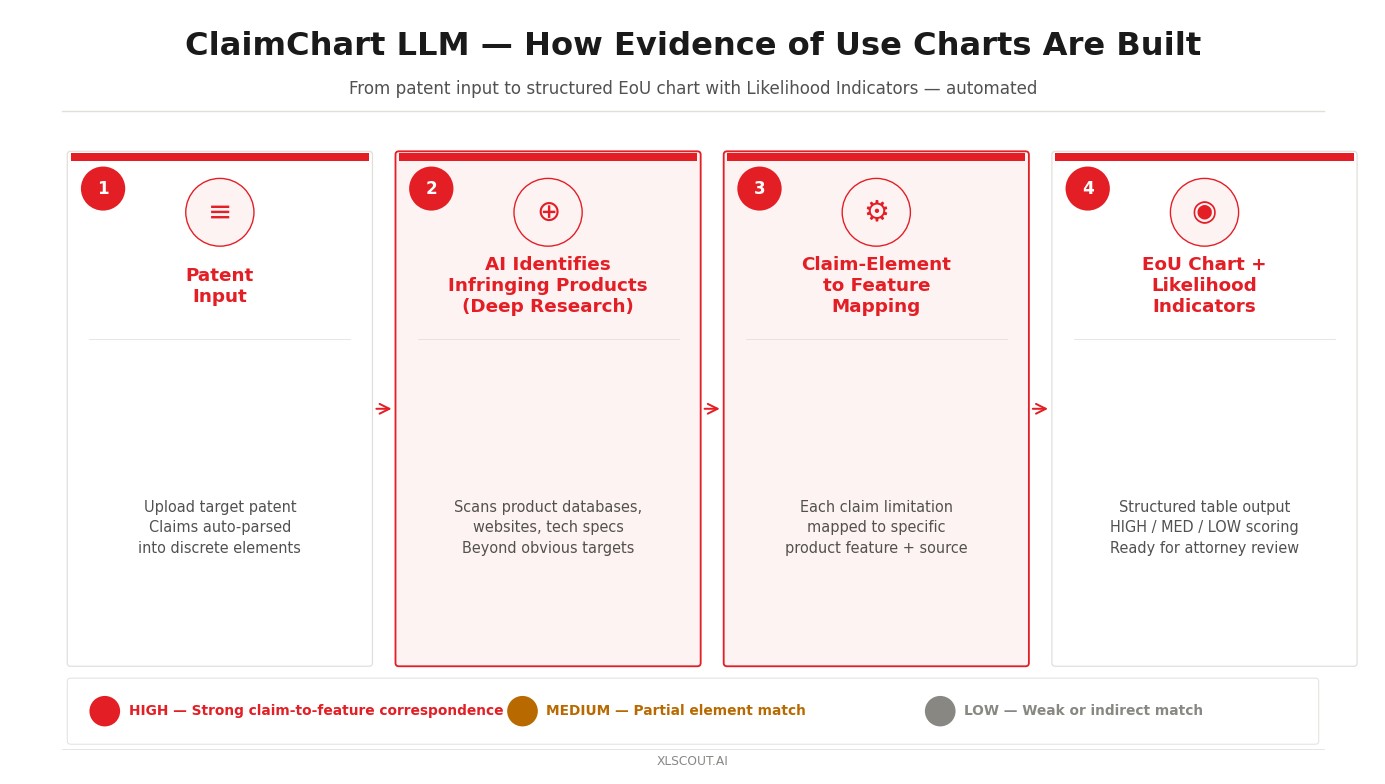
XLSCOUT ClaimChart LLM starts with the patent and builds outward — identifying potentially infringing products, mapping claim elements to product features, and generating structured EoU tables that attorneys can verify and use directly in licensing and litigation workflows.
1. Automated Product Discovery
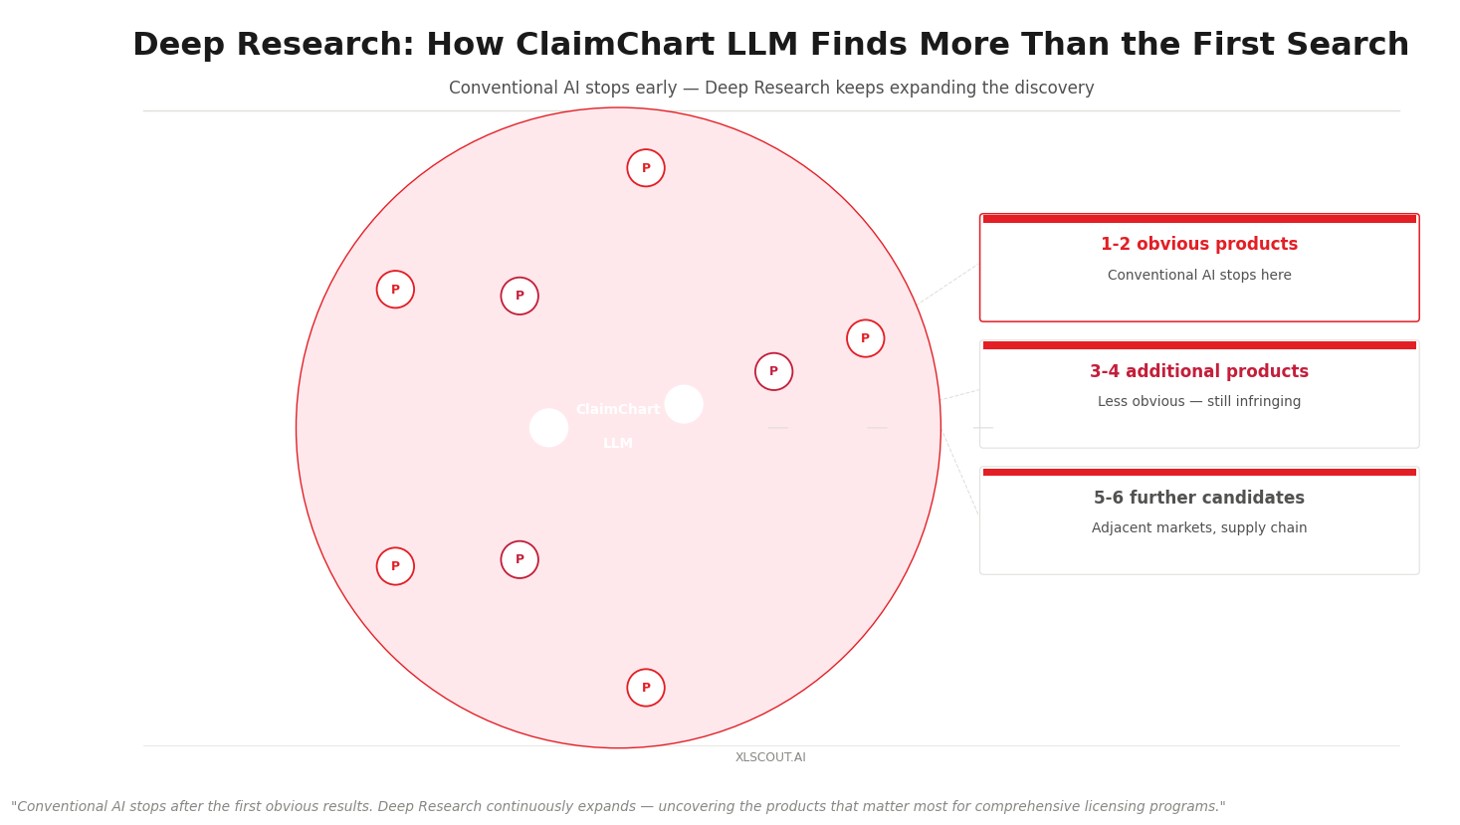
ClaimChart LLM takes a patent as input and automatically identifies products that may practice the asserted claims — searching across product databases, company websites, technical documentation, and specification databases to surface potential infringement targets.
Deep Research extends this discovery continuously — acting as an AI research agent that keeps expanding the investigation beyond initial obvious products, surfacing additional candidates that conventional AI workflows would miss.
2. Claim-Element to Feature Mapping
For each identified product, ClaimChart LLM maps each claim element to a specific product feature with documentary evidence. The mapping is semantic — finding feature descriptions in product documentation that correspond to claim limitations even when the terminology differs.
The output is a structured claim chart with cited sources for every feature match — the format attorneys need to evaluate infringement, support licensing negotiations, or prepare for litigation.
3. Likelihood Indicators and Prioritization
Not every product match is equally strong. ClaimChart LLM assigns Likelihood Indicators — High, Medium, or Low — to each product-patent pairing based on the strength and completeness of the claim-element mapping. High-likelihood matches are prioritized for attorney review and licensing outreach.
This prioritization allows licensing teams to focus attorney time on the strongest infringement positions rather than spending equal time evaluating every candidate regardless of evidence quality.
4. Continuous Product Monitoring
As new products launch and existing products are updated, ClaimChart LLM monitors for new candidates continuously. Combined with PatDigger LLM for licensee identification, the combined system keeps licensing programs current as the market evolves — so the claim chart library grows with the opportunity set.
Why This Matters for Licensing and Litigation Teams
Patlytics claim charting is well-reviewed by Am Law 100 firms but sits within a broader platform priced at $800 to $2,500 per user per month. PatSnap offers claim analysis capabilities but without automated EoU generation. ClaimChart LLM is purpose-built for claim charting — from product discovery through Evidence of Use chart generation — and integrates directly with the broader XLSCOUT patent licensing workflow.
Why XLSCOUT Stands Out
Automated product discovery: identifies potentially infringing products without manual research
Deep Research: continuous AI discovery beyond initial obvious product targets
Semantic claim-element mapping: finds feature descriptions regardless of terminology used in product documentation
Likelihood Indicators: High/Medium/Low scoring prioritizes attorney review time
Source-cited output: every feature match documented with cited product documentation
Connected to PatDigger LLM for licensee identification — one workflow from patent to licensing candidate to EoU chart
See How ClaimChart LLM Supports Patent Licensing and Litigation Workflows
If your team is looking to scale patent licensing beyond the targets manual claim charting allows, ClaimChart LLM provides the product discovery, claim mapping, and structured EoU output that makes systematic licensing practical.