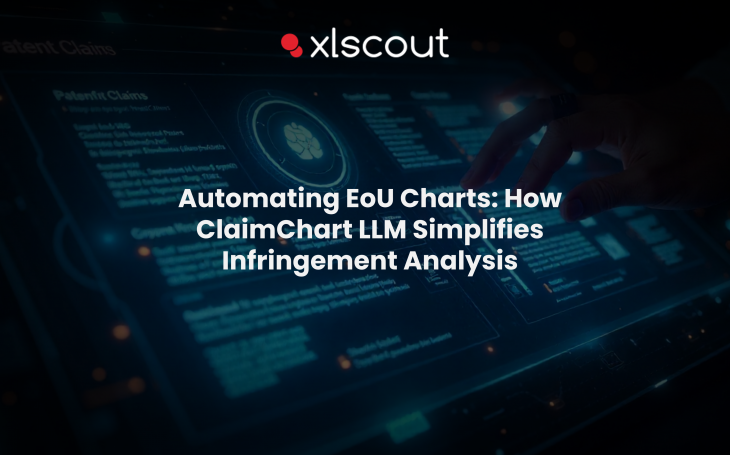
Automating EoU Charts: How ClaimChart LLM Simplifies Infringement Analysis


Introduction: The Role of EoU Charts in IP Enforcement
In the world of intellectual property, patents are more than legal shields — they’re strategic tools for licensing, litigation, and competitive advantage. But asserting those rights effectively requires more than just strong claims. It demands proof. That’s where Evidence of Use (EoU) charts come in — bridging the gap between patent claim analysis and real-world product functionality.
An EoU chart, also known as a patent claim chart, maps each element of a patent claim to a corresponding feature in an allegedly infringing product or service. It’s the foundational document behind licensing proposals, cease-and-desist letters, and courtroom arguments. Whether you’re an operating company, a patent aggregator, or a legal team preparing for enforcement, EoU charts are essential to establish a credible patent infringement analysis.
But traditional EoU charting is slow, manual, and often inconsistent. Reviewing product specifications, gathering screenshots, validating public documentation — all while aligning each claim element with evidence — can take days per chart. Multiply that across multiple patents and targets, and you’re looking at a resource bottleneck.
That’s why the industry is moving toward smarter, faster solutions. AI-powered patent infringement tools are transforming how claim chart mapping tools work — automating the generation of clear, consistent, and evidence-backed EoU charts in a fraction of the time.
Automated patent infringement tools aren’t just about speed—they’re about precision, credibility, and unlocking strategic value from your IP.
What Are EoU Charts and Why They Matter
Evidence of Use (EoU) charts serve as the connective tissue between a patent’s legal language and the real-world technology it’s meant to protect. At their core, these charts break down each element of a patent claim and map it—step by step—to a specific feature or functionality of a target product. This process, known as claim mapping, is what makes EoU charts indispensable in infringement analysis.
Unlike general claim interpretation, an EoU chart includes supporting publicly available evidence such as technical datasheets, user manuals, website screenshots, product images, or even teardown reports. The end goal? To create a structured, credible chart that shows not just that infringement is possible, but that it’s demonstrable and documentable.
Here’s what a standard patent claim chart typically includes:
- A column listing each limitation or clause from the patent claim
- A matching column that maps each clause to the corresponding product feature
- A third column showing proof—often screenshots, excerpts, or links to source material
These charts aren’t just internal artifacts—they’re strategic assets. They form the backbone of licensing discussions, drive patent infringement search workflows, and serve as exhibits in litigation or settlement negotiations.
But the quality of an EoU chart is only as strong as the clarity of the mapping and the reliability of the supporting evidence. That’s why legal teams and IP strategists increasingly rely on specialized patent claim chart generators and claim chart software to ensure rigor, repeatability, and compliance.
Whether you’re pursuing patent claim chart services online or building them in-house, the value of an EoU chart lies in its ability to turn legal abstraction into actionable insight—bridging law and technology through evidence.
Challenges in Manual EoU Chart Creation
Despite their importance, traditional methods of creating Evidence of Use (EoU) charts are anything but efficient. For many IP teams, crafting these charts is still a painstakingly manual process that can consume days—or even weeks—per patent-product pair. The stakes are high, and so are the costs.
The first challenge lies in claim interpretation. Legal and technical experts must parse each patent claim carefully, identifying every limitation and understanding its intended scope. This step is prone to inconsistency, especially across large teams or portfolios, where subjective interpretations can lead to weak or overly broad mappings.
Next comes the product research phase—arguably the most time-intensive. Analysts must scour technical documentation, product listings, teardown videos, spec sheets, and public APIs to find features that correspond to the claim elements. This often involves extracting content manually, capturing screenshots, organizing references, and matching evidence line-by-line with claim language.
Then there’s the formatting. Assembling all of this into a clean, structured patent claims chart—often in spreadsheets or slide decks—requires attention to both legal logic and visual clarity. Each row must tell a cohesive story: claim → mapped feature → supporting proof.
The result? A highly valuable, but fragile and resource-heavy artifact.
And the pain doesn’t end there:
- Low scalability: Repeating this process for multiple products or patent families compounds the effort.
- Risk of oversight: Missing a relevant feature or citing an outdated source can weaken enforcement.
- No knowledge reuse: Charts rarely carry forward into new cases; teams often rebuild from scratch.
In a world where innovation moves fast and product lines evolve quickly, relying on manual tools and siloed expertise isn’t just inefficient—it’s a barrier to value realization. What’s needed is a smarter, more scalable approach to claim charting—and that’s where automation enters the picture.
Enter ClaimChart LLM: Automating the EoU Process
What if building a strong, evidence-backed patent claim chart didn’t require hours of manual effort? What if a single tool could parse complex legal language, understand technical product features, and output a structured, court-ready Evidence of Use (EoU) chart—complete with embedded screenshots, links, and annotations?
That’s exactly what ClaimChart LLM is designed to do.
ClaimChart LLM is an AI-powered claim chart mapping tool built to automate one of the most resource-heavy tasks in patent infringement analysis. By combining natural language understanding, claim parsing, and intelligent evidence extraction, it transforms the traditional EoU workflow into a seamless, scalable, and highly accurate process.
How it works:
- Step 1: Claim Parsing
ClaimChart LLM dissects patent claims into structured, logical elements using advanced language models trained on legal and technical texts.
- Step 2: Product Analysis
The tool then analyzes the target product—whether from manuals, websites, specs, or public data—to identify functional matches for each claim element.
- Step 3: Claim Mapping & Matching
Using AI, it aligns claim language to product features with high precision. It doesn’t just look for keywords—it understands contextual functionality, unlocking insights human reviewers might miss.
- Step 4: Evidence Integration
Finally, it pulls relevant screenshots, text excerpts, and source links into a formatted claim chart—ready for review, licensing, or litigation.
Unlike partial solutions that only offer claim parsing or keyword tagging, ClaimChart LLM delivers end-to-end automation. It functions as a full-stack patent claim chart generator, reducing the time spent on charting by over 75%—without compromising on clarity or credibility.
For legal teams, patent monetization firms, and in-house IP departments, ClaimChart LLM shifts EoU creation from a manual bottleneck to an agile, data-driven workflow. It’s not just another claim generator—it’s an intelligence layer for smarter patent enforcement.
Strategic Benefits of Automated EoU Generation
Automating the EoU process isn’t just about convenience—it’s about enabling a smarter, more scalable IP enforcement strategy. With tools like ClaimChart LLM, legal and IP teams can move beyond the limitations of manual workflows and unlock measurable advantages across the patent lifecycle.
Here’s how automated claim chart generation delivers strategic value:
- Speed at Scale
Creating a single EoU chart manually can take hours. With ClaimChart LLM, that process is reduced by over 75%, enabling teams to generate multiple patent claims charts in parallel—ideal for outbound licensing, portfolio mining, and large-scale enforcement campaigns.
- Consistent, High-Quality Outputs
Manual charting introduces variability, especially across different analysts. ClaimChart LLM applies a standardized AI-driven approach to claim mapping, ensuring consistency in structure, terminology, and supporting evidence.
- Evidence-Backed Confidence
Strong EoU charts rely on clear, defensible connections between claims and product features. Automated claim chart generators like ClaimChart LLM not only match language—they also surface public documentation that reinforces the mapping with real-world proof.
- Reduced Cost and Resource Load
For in-house legal departments and law firms alike, automation translates directly into time and cost savings. Fewer hours spent on repetitive research means more focus on high-value legal strategy and decision-making.
- Faster Path to Enforcement or Licensing
When every day counts, automated tools help legal teams act decisively—whether pursuing litigation, engaging in licensing talks, or conducting a patent infringement search to assess a new target.
AI claim charting tools like ClaimChart LLM empowers organizations to operationalize their IP assets. It’s not just about replacing manual effort—it’s about making evidence generation faster, smarter, and strategically aligned with business goals.
Why ClaimChart LLM Sets a New Standard
As the complexity of products and portfolios grows, so does the demand for tools that can support faster, more precise patent claim analysis. While many platforms offer partial solutions—claim parsing tools, keyword search engines, or chart formatting aids—few address the full scope of what’s needed to generate reliable, evidence-backed Evidence of Use (EoU) charts at scale.
ClaimChart LLM represents a shift in how patent professionals approach infringement analysis. Rather than treating claim chart creation as a fragmented, manual task, it applies end-to-end automation across the full EoU workflow.
Here’s how this approach differs from traditional or semi-automated methods:
- Unified Workflow from Claim to Chart
Most tools focus on a single step: parsing claims, tagging keywords, or building templates. ClaimChart LLM integrates all steps—claim interpretation, product analysis, claim mapping, and evidence sourcing—into a cohesive process.
- Contextual, Not Just Textual, Matching
Traditional systems rely heavily on surface-level keyword matches. ClaimChart LLM applies AI trained on legal and technical language to detect functional similarities, even when terminology differs. This improves the accuracy of claim mapping and reduces false negatives.
- Structured Evidence Integration
The tool doesn’t stop at identifying matches. It links each mapped feature with supporting evidence—product manuals, documentation, screenshots, or API references—directly within the patent claim chart.
- Scalable Across Multiple Patents and Products
Manual charting becomes impractical when assessing dozens of products or running infringement searches across global markets. It scales the process, making it suitable for large portfolios, licensing programs, and competitive monitoring.
- Consistency and Legal Clarity
With predefined logic and standardized chart outputs, ClaimChart LLM ensures that each claim chart aligns with the expectations of licensing partners, internal reviewers, or courts—reducing variability introduced by individual analysts.
This combination of precision, scale, and structure sets a new benchmark for claim chart software. It reflects a broader trend in IP management: moving from reactive, manual reviews to proactive, AI-enabled enforcement strategies.
Conclusion: Smarter Enforcement Starts with Smarter Search
In an environment where innovation moves fast and competition is global, effective patent enforcement requires more than legal expertise—it demands tools that match the scale, speed, and complexity of today’s markets.
Manual claim charting can no longer keep up. It’s time-intensive, prone to inconsistency, and difficult to scale when portfolios grow or timelines compress. For organizations serious about maximizing the value of their IP, automation is no longer optional—it’s essential.
ClaimChart LLM brings automation to the heart of patent infringement analysis. By transforming how EoU charts are created—faster, more accurately, and at scale—it allows teams to detect infringement, prepare evidence, and act decisively.
Whether the goal is licensing, litigation, or strategic portfolio review, tools like ClaimChart LLM empower IP professionals to focus on what matters most: making informed, timely decisions with confidence.
Smarter infringement analysis starts with smarter search. Let AI guide the way.
Why stay behind? Get in touch with us!

Copyrights © 2026 XLSCOUT. All Rights Reserved.