
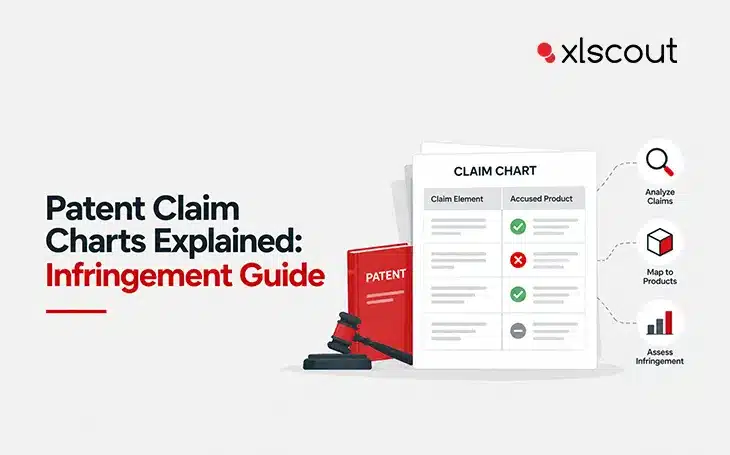
Quick answer: A patent claim chart is a structured, element-by-element comparison table that maps the language of a patent claim to specific features of an accused product or a prior art reference — proving, line by line, that every claimed element is present. Claim charts are the core evidentiary document behind infringement notices, licensing negotiations, invalidity challenges, and litigation.
If you’ve ever been told a competitor’s product « reads on » your patent, a claim chart is how that statement gets proven rather than merely asserted. Understanding the different types of patent infringement is the necessary starting point, because the type of infringement you’re evaluating shapes exactly what a claim chart needs to demonstrate. Below, we break down its structure, the infringement types it’s used to establish, and how to build one that holds up under scrutiny.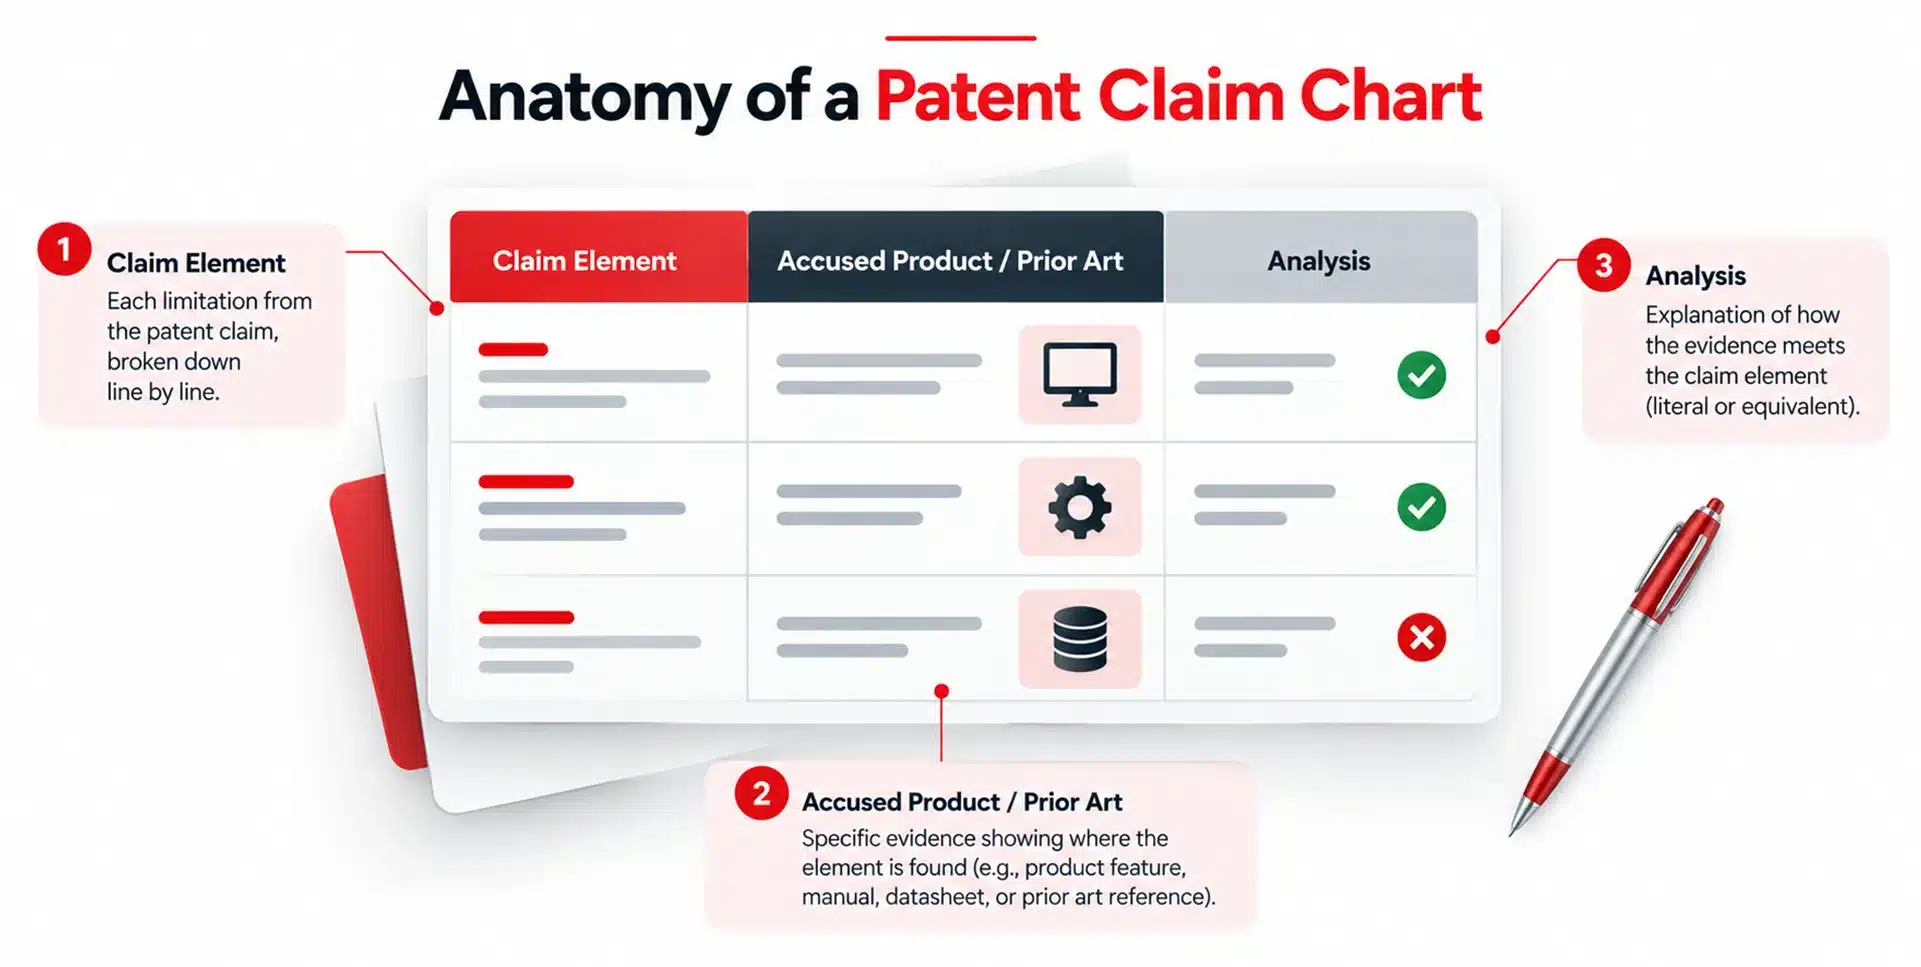
What Is a Patent Claim Chart, Exactly?
A claim chart splits a patent claim into its individual elements — every « a processor configured to… », every « wherein the… », every distinct limitation — and places each one next to direct evidence that an accused product (or a prior art reference, in an invalidity context) contains that exact element. Each row must show complete element-for-element correspondence; a claim chart that only shows partial or approximate matches is not persuasive evidence of use.
Claim charts serve two nearly opposite purposes depending on context:
|
Use Case |
What the Chart Proves |
|
Infringement (evidence of use) |
An accused product contains every element of your claim |
|
Invalidity |
A prior art reference already contains every element of a claim being challenged |
Types of Patent Infringement a Claim Chart Can Establish
Infringement Type |
Definition |
Claim Chart Focus |
|
Direct (literal) |
The accused product contains every claim element exactly as written |
Word-for-word element mapping |
|
Doctrine of equivalents |
The accused product performs substantially the same function, in substantially the same way, for substantially the same result — even without a literal match |
Functional equivalence mapping alongside literal comparison |
|
Indirect / induced |
A party knowingly encourages or instructs another to infringe (e.g., through user manuals) |
Evidence chart often includes instructional materials as the « use » evidence |
|
Contributory |
Supplying a component with no substantial non-infringing use, knowing it will be used to infringe |
Chart focuses on the component’s lack of alternative legitimate use |
|
Willful |
Infringement continuing with knowledge of the patent (affects damages, not liability itself) |
Chart is paired with evidence of prior notice/knowledge |
For a broader, plain-language walkthrough of how each of these categories plays out in practice — including why « patent violation » is a common but imprecise term people search for when they actually mean one of these five infringement types — see our companion article on patent violation detection.
Anatomy of a Claim Chart: The 3 Required Columns
- Claim Element— the exact claim language, broken into its smallest meaningful limitations (avoid summarizing or paraphrasing the claim text itself).
- Accused Product / Reference— the specific feature, component, or behavior in the target product (or prior art document) that corresponds to that element.
- Evidence & Citation— the concrete source proving the correspondence: a datasheet page, a teardown photo, a source-code excerpt, a manual screenshot, or a specific paragraph/figure from a prior art reference.
A chart missing column 3 — evidence — is an assertion, not analysis. This is the single most common weakness in amateur claim charts, and the first thing opposing counsel will attack. Our practical walkthrough on claim charts made easy: best practices for using AI tools covers exactly how to keep every row defensible rather than aspirational.
Building a Claim Chart: Step by Step
- Select the asserted claim(s). Start with independent claims — dependent claims only matter if the independent claim they rely on is proven first.
- Break the claim into discrete elements. Every limitation gets its own row; don’t combine multiple limitations into one row even if they appear in the same sentence of the claim.
- Gather evidence per element. Product documentation, teardowns, API specifications, source code (where accessible), marketing materials, and user manuals are all standard evidence sources.
- Map element-to-evidence precisely. Avoid vague characterizations (« the product likely does this ») — cite the specific document, page, or observable behavior.
- If an element can’t be mapped with available evidence, note it as a gap rather than forcing a weak match — a claim chart with one unsupported row undermines the credibility of the entire document.
- Have it reviewed by counsel before it’s used in a licensing demand, litigation filing, or invalidity submission — and consider how the finished chart fits into a broader patent litigation strategy rather than treating it as a standalone deliverable.
Claim Charts in the Digital Age: Why the Evidence-Gathering Step Got Harder
Software, firmware, and connected-device patents have made claim charting significantly more evidence-intensive than it used to be for purely mechanical inventions. Our piece on patent infringement in the digital age covers why: evidence for a single claim element might now be scattered across a product’s firmware changelog, a cloud API specification, a mobile app’s decompiled behavior, and a support-forum post describing how a feature actually works — rather than sitting in one physical teardown the way it might for a mechanical device. This is also precisely why manual claim charting timelines have stretched even as the underlying legal standard hasn’t changed.
Why Claim Charting Is Traditionally Slow — and How AI Changes That
Manually building a claim chart against a single accused product can take an experienced analyst days, particularly for software or hardware patents with many limitations and evidence scattered across manuals, patches, and technical forums as described above. This is precisely the bottleneck AI-powered claim charting tools target: automatically surfacing candidate evidence per claim element across product documentation and technical literature, then letting an analyst verify and refine the mapping rather than build it from a blank page. Our overview of automating patent infringement analysis with AI claim charts covers this shift in more depth, including how it changes the economics of pursuing infringement claims that would previously have been too labor-intensive to investigate thoroughly.
Platforms like XLSCOUT’s ClaimChart LLM apply this to both infringement and invalidity charting — using explainable AI to show why each element-to-evidence match was suggested, which matters because an unexplained AI match is no more persuasive in a legal context than an unsupported human assertion. This same underlying evidence-mapping capability is also what powers faster litigation outcome analysis, since a well-built claim chart is frequently the single most time-consuming artifact in preparing an infringement case.
Claim Charts vs. a Full Infringement Clearance Search
It’s worth distinguishing a claim chart from a broader clearance exercise. A claim chart is built against a specific claim and a specific accused product once infringement is already suspected. A freedom-to-operate or infringement clearance search, by contrast, is typically run proactively — before a product launches — to identify which third-party patents might be a problem in the first place, across an entire product rather than one suspected claim. Claim charting usually follows clearance work once a specific risk or dispute has been identified, not the other way around.