XLSCOUT Platform Version Release 1.56
Major Updates in ClaimChart LLM
1. Enable-Deep Research
Deep Research has now been integrated directly into the main Claim-Chart LLM workflow. This means users no longer need to access Deep Research separately. They can now enable it from within the standard claim-to-product analysis process, making the workflow smoother and easier to follow.
Broader Product Discovery for One Patent at a Time
Users can enable the Deep Research toggle in the Claim-Chart LLM interface to perform a more expanded search for relevant products.
Currently, Deep Research supports analysis for one patent at a time.
When enabled, Deep Research helps improve:
- Product discovery coverage
- Discovery of products beyond the standard search workflow
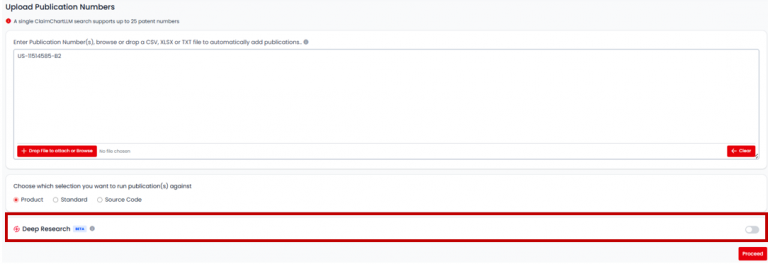
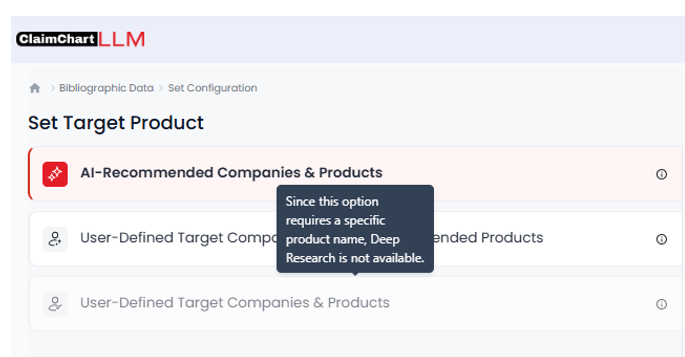
Important Note: When Deep Research is enabled, the User-Defined Target Companies & Products option will be disabled.
This is because User-Defined Target Companies & Products is used when users already know which companies and products they want to analyze. Deep Research, on the other hand, is designed to discover relevant products more broadly through the AI-driven workflow.
2. Deep Research Indicator on History Card
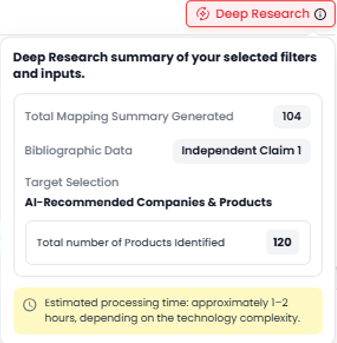
A Deep Research indicator will now be displayed on the history card to clearly identify cases where Deep Research was performed.

By hovering over the indicator, users can view a quick summary of the Deep Research run, including:
- Number of products for which mapping summaries were generated
- Number of products identified during Deep Research
- Selected target claim
- Search type used, such as AI-Recommended Companies & Products
This makes it easier to track, review, and compare Deep Research cases from the history page.
3. Patdigger Analysis Dashboard
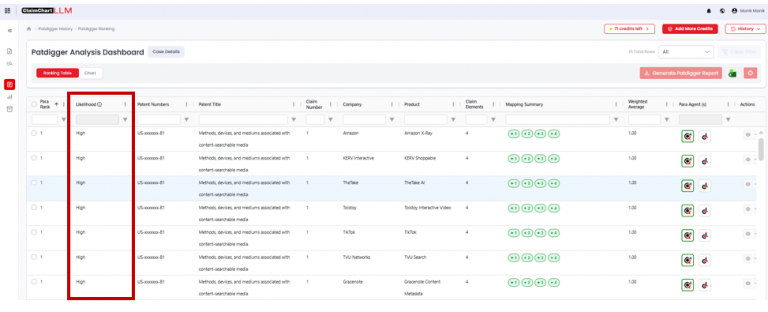
The Ranking table in Patdigger dashboard is now having additional field as “Likelihood” as High, Medium or Low describing the potential overlap of publication number with the identified respective product.
Viewing Low-Likelihood Results
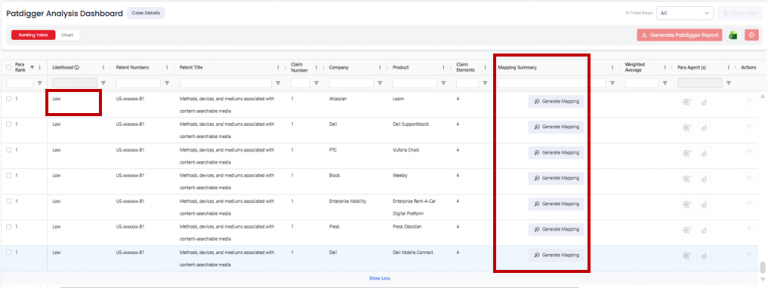
To keep the ranking table focused and easy to review, products with Low Likelihood are not shown immediately in the main view. Users can click Show More at the bottom of the ranking table to view these additional results.
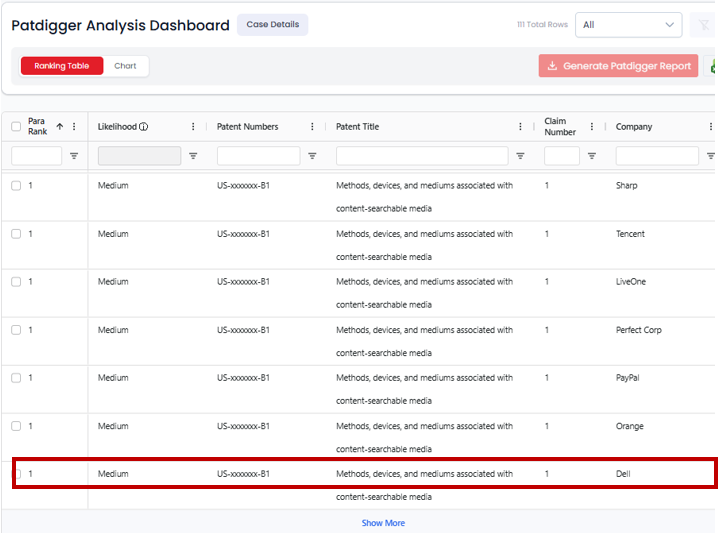
After expanding the low-likelihood results, users can also generate Mapping Summary & Weighted Average.
This gives users flexibility to review lower-ranked results when needed, without making the main dashboard crowded.
Rows corresponding to products with a “Low” Likelihood value can be viewed by selecting the “Show More” option located at the bottom of the ranking Table.
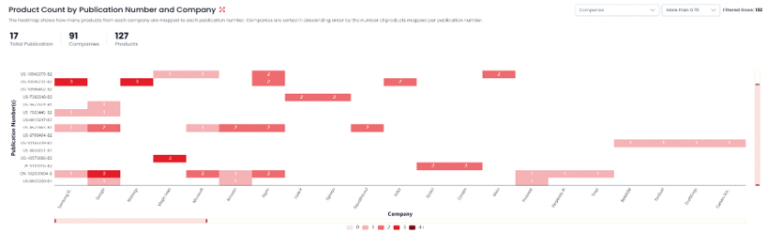
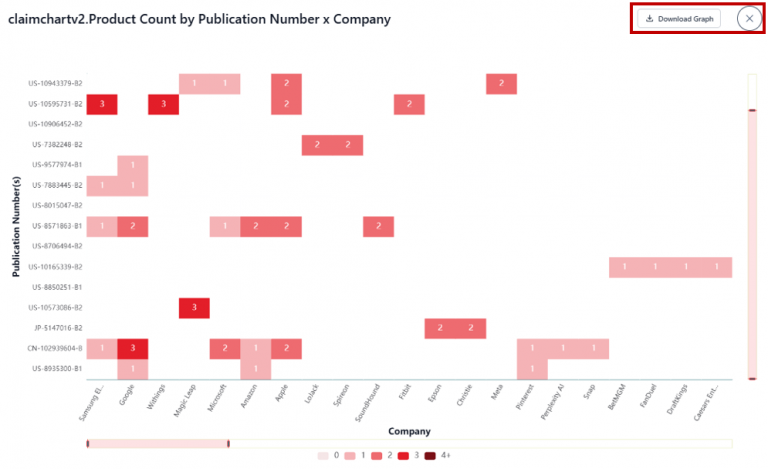
1. Product Count by Publication Number and Company
New heatmap graph has been added showing the frequency of products being mapped to the publication numbers.
2. Graph Download and filter-based insights
The graphs now provide additional information regarding Total publications, Companies and Products according to the assigned filter of companies or weighted average.
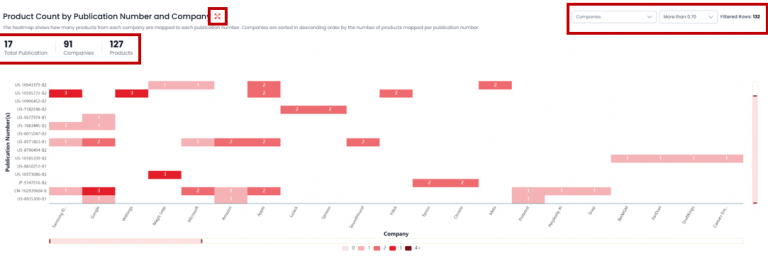
Each graph now has an option to download the same graph as “.png file”.
ABOUTS US
XLSCOUT is an SOC2 Type II certified, integrated innovation & patent monetization platform at the forefront of the global innovation and IP industry, harnessing the potential of advanced Al technologies like Large Language Models (LLMs) and Generative Al for idea validation, optimizing ideation, creating high-value patents, and monetizing innovation.
- CANADA – Toronto, Ontario
Nucleus @ MaRS Waterfront, Waterfront Innovation Centre, Suite 200, Box 87 – 155, Queens Quay E, Toronto, ON M5A 0W4 - USA – Wilmington, Delaware
1000 North West Street Suite 1200 PMB # 4024, Wilmington DE 19801 - JAPAN – Chiyoda-Ku, Tokyo
XLSCOUT XLPAT G.K., Level 20, Marunouchi Trust Tower – Main 1-6-3 Marunouchi, Chiyoda-Ku, Tokyo, Japan – 100-0005 - INDIA – Mohali, Punjab
Unit 502-503, Tower A, 5th Floor, Bestech Business Tower, Mohali, Punjab – 160055 - GERMANY – Munich, Bavaria
Am Hirtenberg 13, 82064 Straßlach-Dingharting, Deutschland
Phone: +1 (647) 619-0002
Email: contact@xlscout.com
Copyrights © 2025 XLSCOUT. All Rights Reserved.