XLSCOUT Version Release 1.53
Major Updates in ClaimChart LLM
ClaimChart LLM now opens with a charts-first interface, making it easier to quickly understand mappings, relationships, and risk areas at a glance, before diving into individual patents or products.
1. Redesigned User Interface for Faster Insights
A refresh user interface to focus on enhanced visual insights for mappings.
- Graphs: New charts are now available in the Charts section, allowing you to visually analyze mappings, overlaps, and scores more effectively.
- Interface: More filters and information regarding the publications, companies and reports has been added.
2. Charts Interface
- The default landing view when opening reports is now the Charts interface, enabling faster visual understanding before detailed review.
- You can double-click any chart to directly view the corresponding filtered patents in the ranking table.
3. Graphs
Newly Added Charts in ClaimChart LLM
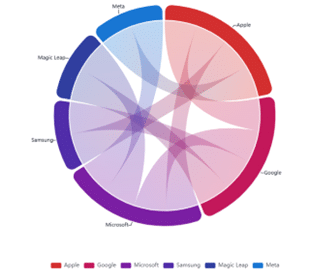
- Company Publication Sharing – Chord Diagram:
This chart helps you understand how different companies share publications.
- The size of each arc represents the number of publications per company.
- Connecting ribbons indicate shared publications between companies.
- You can search or filter companies using the dropdown above the chart.
- By default, the chart displays up to 8 companies with the highest publication overlap.
- Company Publication Sharing – Chord Diagram:
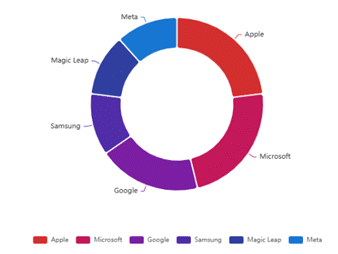
- Company Distribution:
A donut chart showing how products are distributed across companies.
- You can search or filter companies using the dropdown above the chart.
- By default, the chart displays up to 8 companies with the highest product counts.
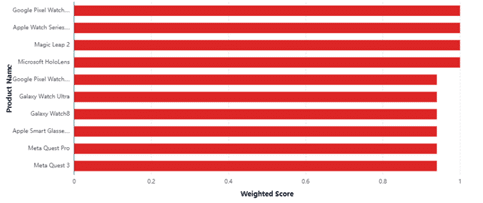
- Weighted Score by Product:
A bar chart that allows you to compare the weighted average scores of patents across products.
- Products can be filtered by weighted average score or by company.
- By default, the chart displays the top 10 products.
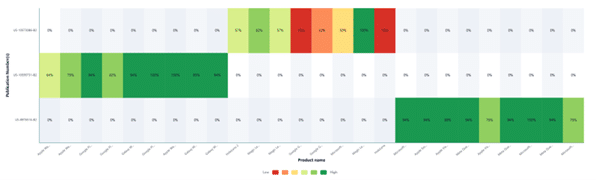
- Patent × Product Score Heatmap:
A heatmap visualization showing weighted scores between patents and their mapped products.
- By default, the chart highlights products with a weighted average score of 1.
- Displays up to 15 publication numbers for focused analysis.
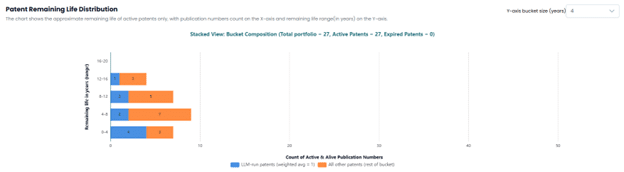
- Patent Remaining Life Distribution:
A bar chart showing the approximate remaining life of active patents.
- Only active patents are included.
- Publications are differentiated based on whether their weighted average score equals 1.
- A four-year range is applied by default for easier interpretation.
Updates to Existing Charts
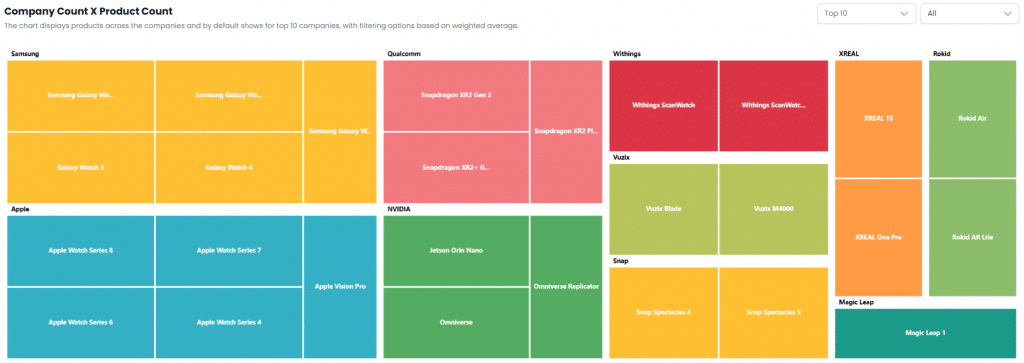
- Company Count × Product Count
By default, the chart displays the top 10 companies based on product count. Results can be filtered using weighted average score thresholds.
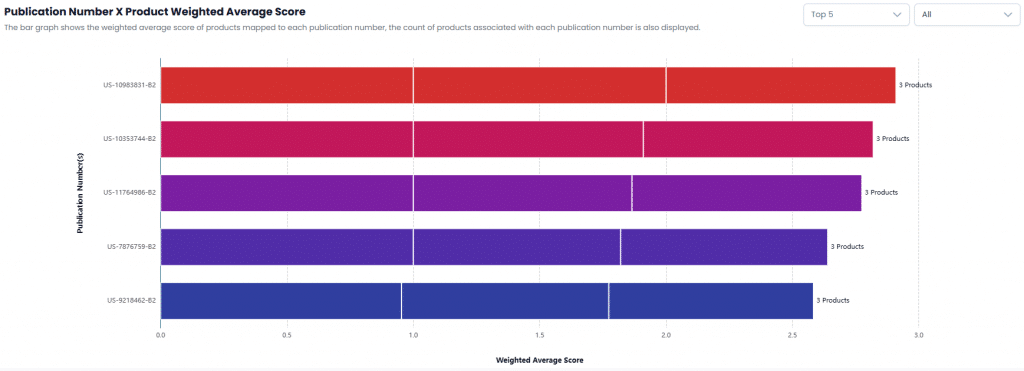
- Publication Number × Product Weighted Average Score
Displays the top 5 patents by default. Can be filtered based on weighted average score.
4. Overview and filters
- A summary view now displays total publications, companies, products, and completed reports.

- The interface clearly shows filtered rows versus total rows. By default, results are filtered to show rows with a weighted average score greater than 0.80.

- A summary view now displays total publications, companies, products, and completed reports.
Minor Updates in ClaimChart LLM
1. AI Assistant – Enhanced Discovery & Technical Categorization
- The AI Assistant now groups AI-suggested companies and products into clear technical categories, making discovery easier and more structured.Users can select relevant companies for deeper analysis, helping keep evaluations focused and contextually meaningful.
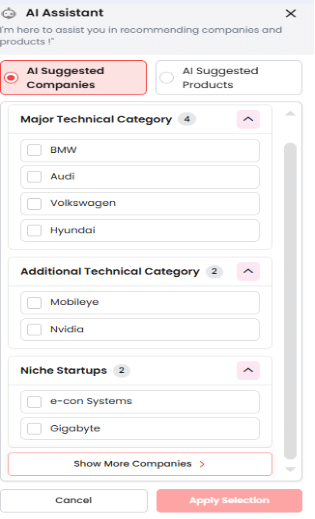
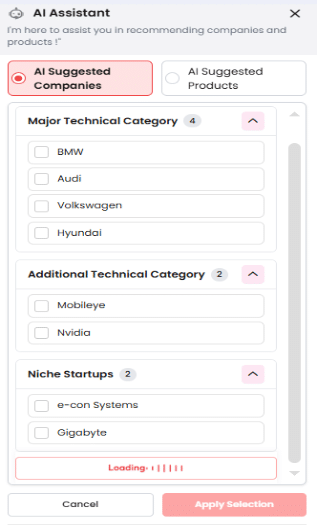
- A new Show More Companies/Show More Products option allows users to seamlessly explore additional AI-recommended companies or products as needed.
- Users can easily switch between AI Suggested Companies and AI Suggested Products, enabling flexible exploration based on analysis objectives.
- The updated experience is more visual, structured, and intuitive, making it easier to navigate across established players and emerging innovators.
- The AI Assistant now groups AI-suggested companies and products into clear technical categories, making discovery easier and more structured.
- You can select relevant companies for deeper analysis, helping keep evaluations focused and contextually relevant.
- A new Show More Companies / Show More Products option allows you to explore additional AI-recommended entities when needed.
- You can easily switch between AI-Suggested Companies and AI-Suggested Products based on your analysis objectives.
- The overall experience is now more visual, organized, and intuitive, supporting easier navigation across both established players and emerging innovators.
ABOUTS US
XLSCOUT is an SOC2 Type II certified, integrated innovation & patent monetization platform at the forefront of the global innovation and IP industry, harnessing the potential of advanced Al technologies like Large Language Models (LLMs) and Generative Al for idea validation, optimizing ideation, creating high-value patents, and monetizing innovation.
- CANADA – Toronto, Ontario
Nucleus @ MaRS Waterfront, Waterfront Innovation Centre, Suite 200, Box 87 – 155, Queens Quay E, Toronto, ON M5A 0W4 - USA – Wilmington, Delaware
1000 North West Street Suite 1200 PMB # 4024, Wilmington DE 19801 - JAPAN – Chiyoda-Ku, Tokyo
XLSCOUT XLPAT G.K., Level 20, Marunouchi Trust Tower – Main 1-6-3 Marunouchi, Chiyoda-Ku, Tokyo, Japan – 100-0005 - INDIA – Mohali, Punjab
Unit 502-503, Tower A, 5th Floor, Bestech Business Tower, Mohali, Punjab – 160055 - GERMANY – Munich, Bavaria
Am Hirtenberg 13, 82064 Straßlach-Dingharting, Deutschland
Phone: +1 (647) 619-0002
Email: contact@xlscout.com
Copyrights © 2025 XLSCOUT. All Rights Reserved.