1. Graph Wizard – Taxonomy Graphs for GXTI and SDG
User can now plot graphs for Green Transformation Technologies Inventory (GXTI) and Sustainable development Goals (SDGs) taxonomies templates. Further, user can generate customized graphs with GXTI and SDG taxonomy in combination with other parameters. Users have the flexibility to select a GXTI or SDG taxonomy for one dimension and various parameters such as Assignee, Country, Publication Year, Application Year, Countries, CPC, IPC, and more for the second dimension.
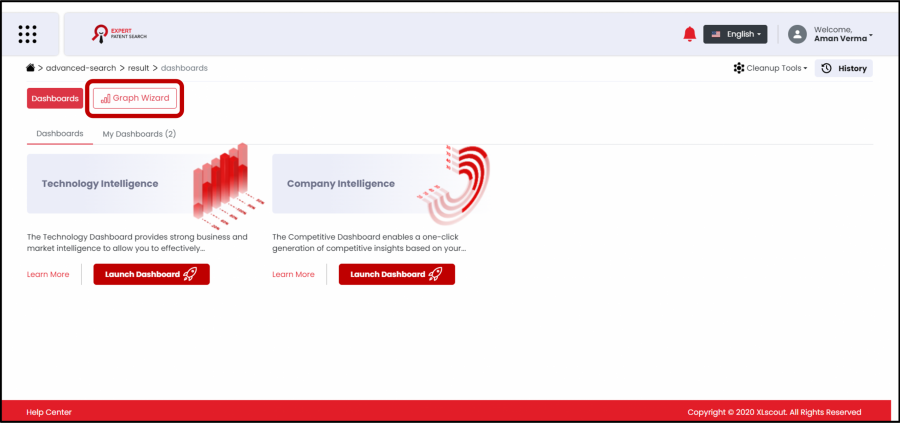
a) Click on Graph Wizard to enter the graph wizard module.
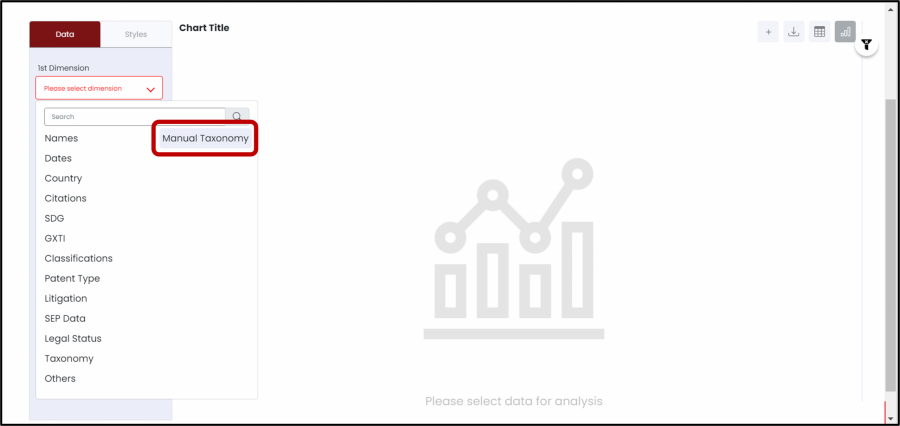
b) In the Graph Wizard module, select manual taxonomy from the dropdown.
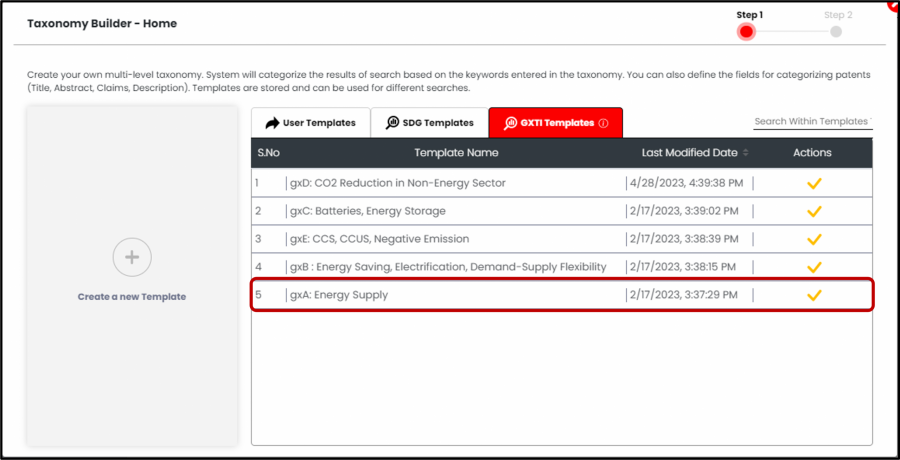
c) Go to “GXTI Templates” through “Select Taxonomy” option and apply the specific GXTI template for which the user wants to create the taxonomy graphs.
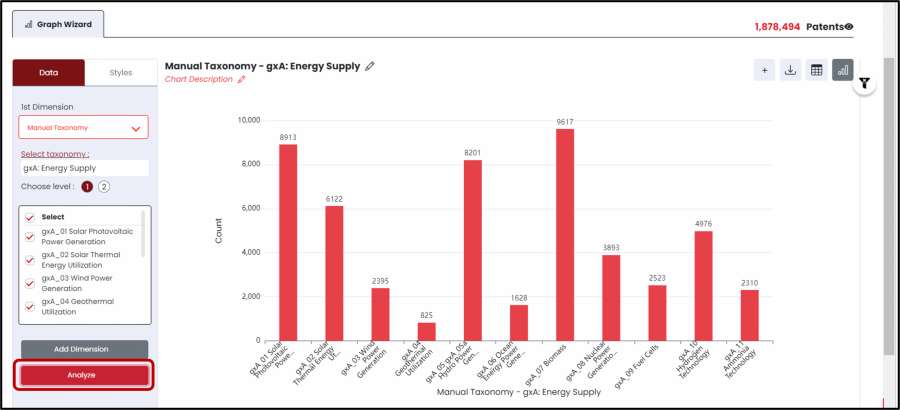
d) Click on “Analyze” to generate graph for level 1 category of GXTI.
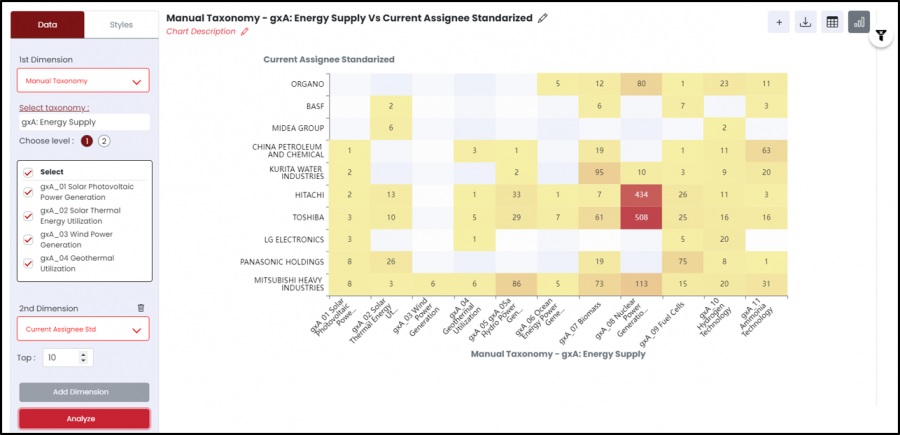
e) Click on “Add Dimension” and choose “Current Assignee Standardized” to plot against GXTI Taxonomy.
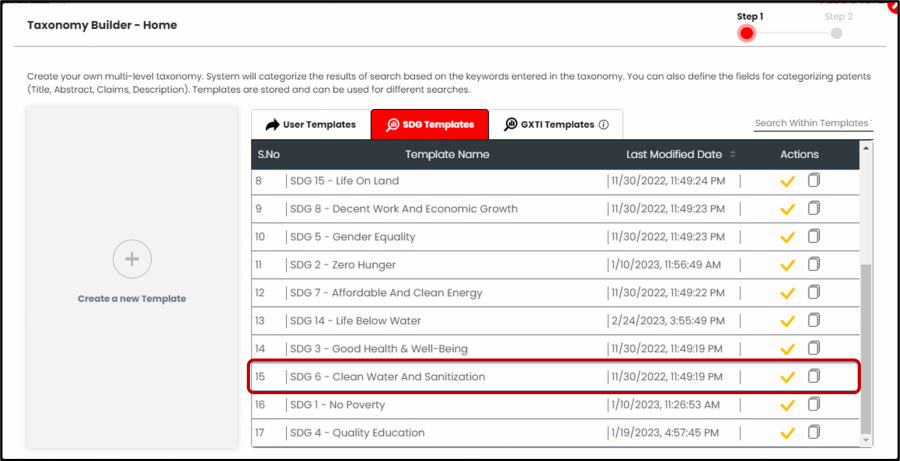
f) Select manual taxonomy in Graph Wizard dropdown. Go to “SDG Templates” through “Select Taxonomy” option and apply the specific SDG template for which the user wants to create the taxonomy graphs.
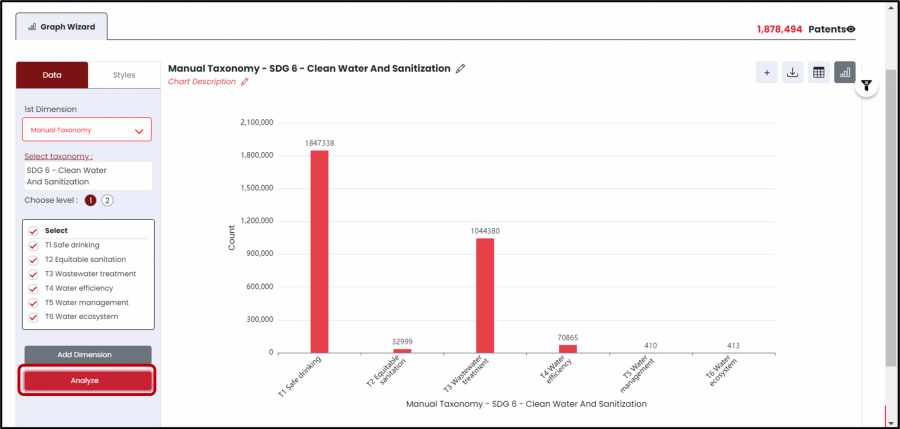
g) Click on “Analyze” to generate graph for level 1 category of SDG.
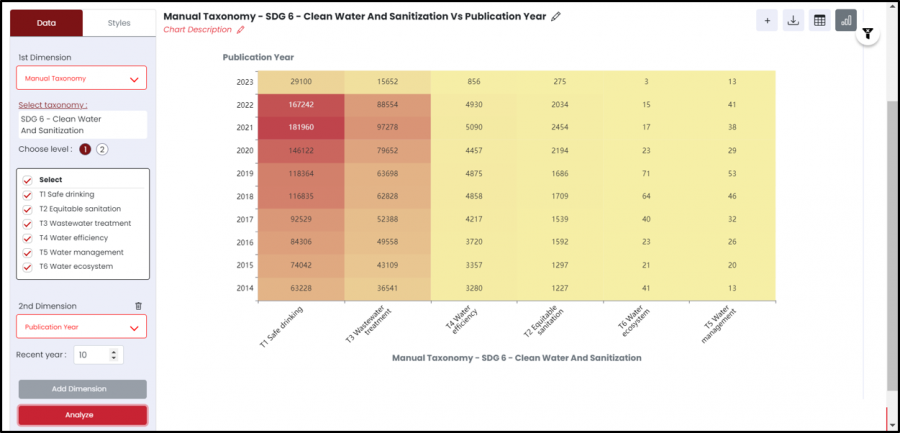
h) Click on “Add Dimension” and choose “Publication Year” to plot against SDG Taxonomy.
2. Graph Wizard – Taxonomy Graphs
Xlscout has introduced support for Taxonomy graphs, enabling users to generate customized graphs with manual taxonomy. Users have the flexibility to select a manual taxonomy for one dimension and various parameters such as Assignee, Country, Publication Year, Application Year, Countries, CPC, IPC, and more for the second dimension.
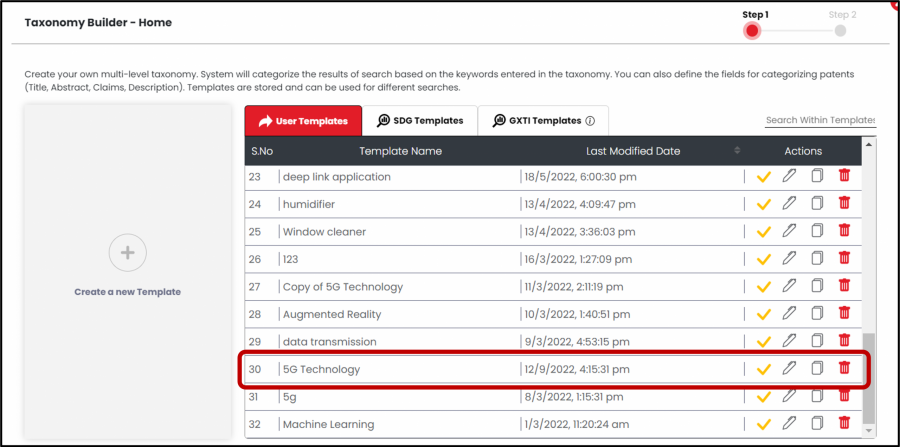
a) Select manual taxonomy in Graph Wizard dropdown. Go to “User Templates” option and apply the specific Taxonomy template for which the user wants to create the taxonomy graphs.
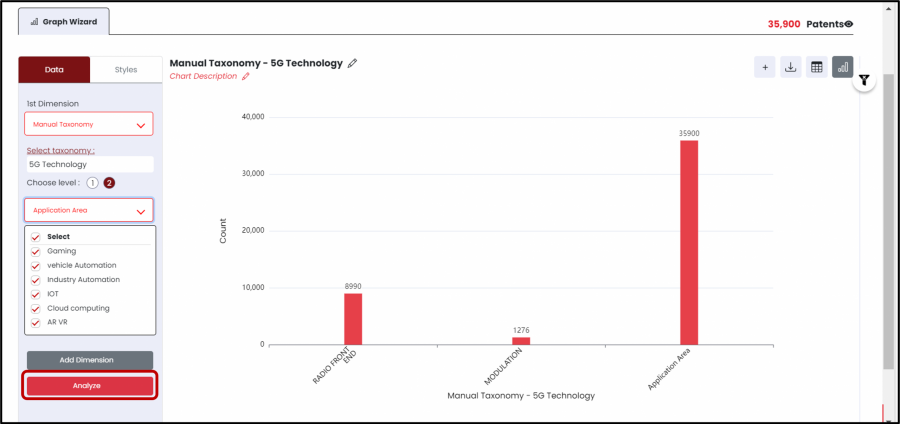
b) Click on “Analyze” to plot the taxonomy graphs on level 1 category.
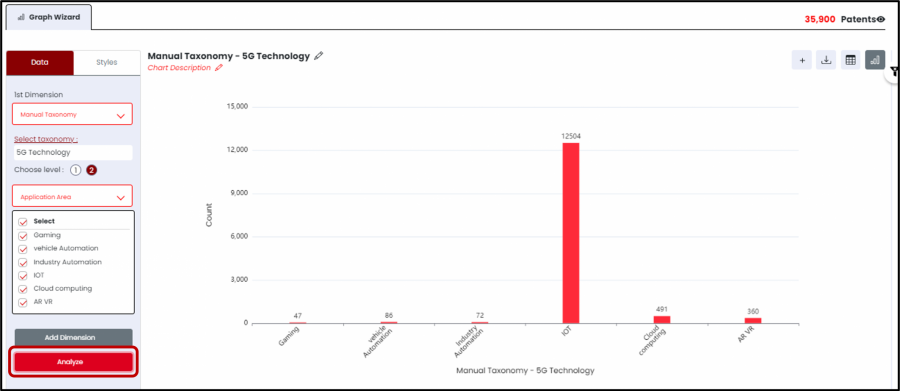
c) Go to “Choose level 2”. Select the level 1 category for which the user wants to plot level 2 category graph. Click on “Analyze” to create the taxonomy graphs on level 2 category.
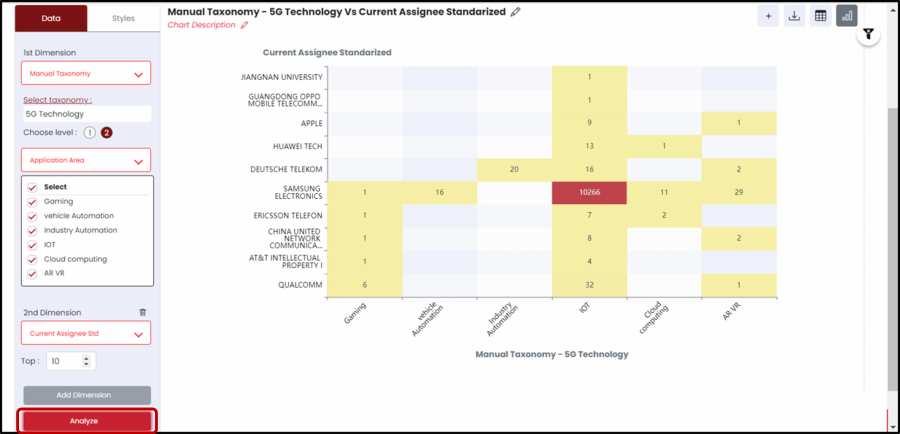
d) Click on “Add Dimension” to add any parameter from dropdown to plot that specific parameter against the manual taxonomy. For example, select “Current Assignee Standardized” in second dimensions. Click on the “Analyze” button to plot the graph between level 2 category of manual taxonomy and current assignee standardized.
Minor Updates
1. User can now generate Excel report for Invalidator results.
XLSCOUT engineered data with best-in-class Artificial Intelligence (AI) technologies to develop the most accurate, comprehensive, and intelligent patent & research publication database. Using Natural Language Processing (NLP), Machine Learning (ML), and Innovation/Scientific Principles, XLSCOUT gives you more time and reliable insights to confidently make data-driven strategic decisions
USA – Delaware 1000 N, West Street Suite 1200, Wilmington, Delaware, 19801